HPC tips
IN A VERY DRAFT FORM sorry...
Likwid hardware support
Sadly there is no support for likwid for some of the recent CPUs... You'll have to use the machines in class or find another machine somewhere.
todo details
Roofline model
read this !
- https://github.com/RRZE-HPC/likwid/wiki/Tutorial%3A-Empirical-Roofline-Model
- https://github.com/RRZE-HPC/likwid/wiki/Likwid-Bench
Time
The easiest way to measure the time
TODO how to interpret the 3 displayed times
time -vgives some interesting details- you to see the peak memory usage to estimate how much your program need at maximum. todo how
- you to see the percentage of CPU to estimate how good you are using all your cores with multi-threading. todo how
TODO give grep version
Note: make sure you'are using /usr/bin/time and not the shell builtin. You can skip it by running command time ... or directly /usr/bin/time ....
Time is nice to get a quick measure, but if you want a more precise one use hyperfine.
Memory bugs debugging
free(): invalid sizeormunmap_chunk(): invalid pointer-> the pointer has changed or the metadata on the heap in the few bytes just before the zone has been corrupted.- make sure the pointer value is the same on
free()call and atmalloc()creation - printf the few bytes before the address returned by
mallocto make sure it wasn't changed by another buffer allocated right before with access beyond the end
- make sure the pointer value is the same on
lstopo to see a quick preview of your CPU microarchitecture
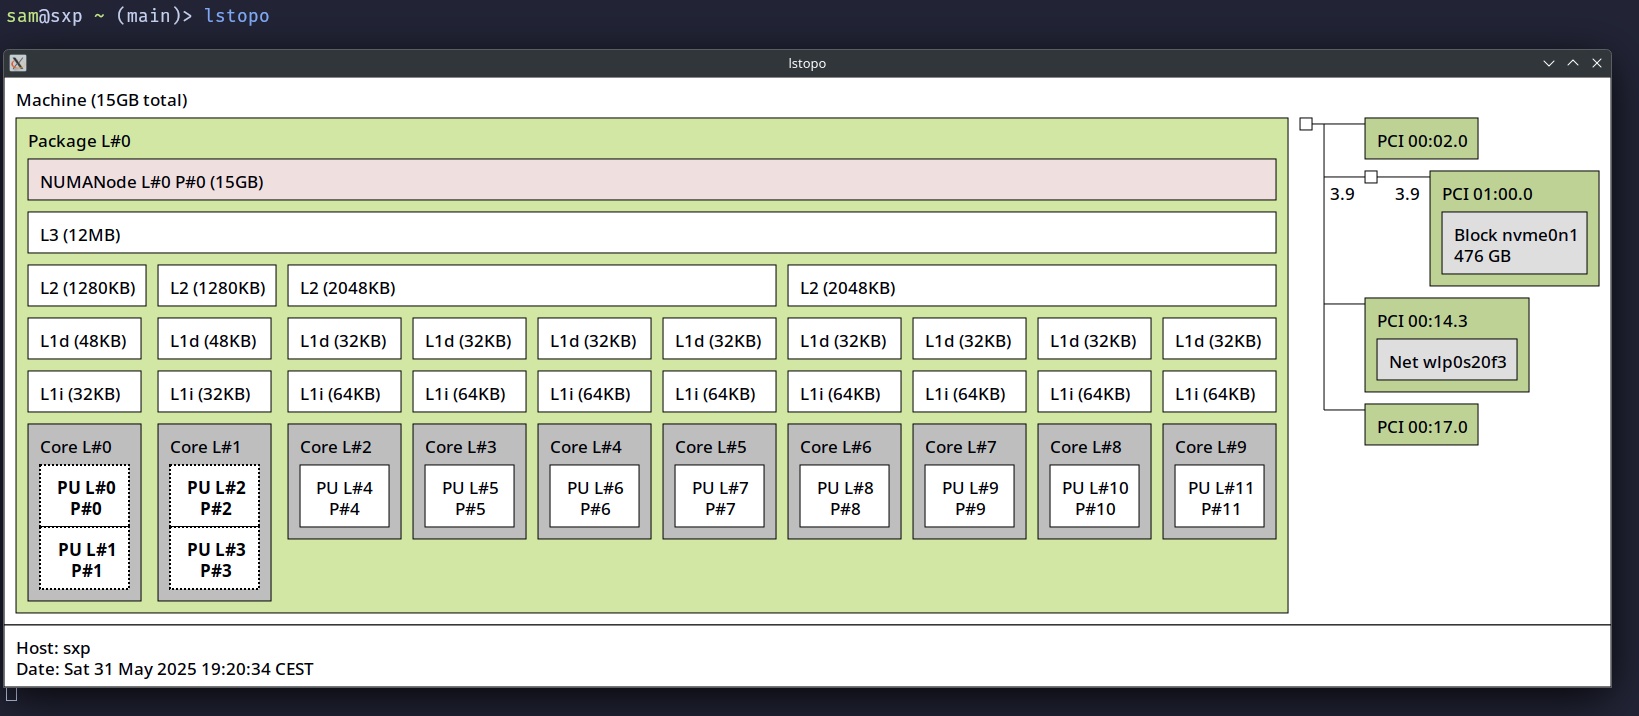
How to interpret what you see
- The size of the 3 levels of cache
- Some cores are regrouped toghether in regions
- The
L1dis the L1 cache for data, theL1iis the cache for instructions - You can see where the L2 and L3 is shared, you could make some guess about cache use with this info
- Each CPU core and physical threads (The core 0 and 1 have 2 physical threads)
- The physical numbers (from 0 to 11) is what you need to use when you pin via
taskset -c 3 ./somecommandor viaperf record -C 3
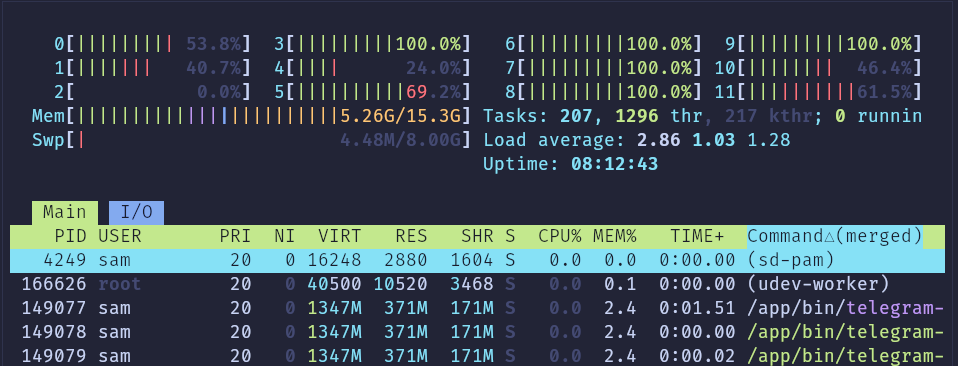
Htop to see an overview of each CPU usage
If you run htop with a delay of 1/10 (1 tenth), you can see the look of your CPU usage.
htop -d 1
Hyperfine
- Frequent errors: forgetting the quotes around the command
- Waiting too long of the 10 executions for a very slow program (multiple seconds), you can use
-ror--max-runsto fix a limit of executions.
Building benchmarks easy to run and document
Lab machine
Perf not working with kernel
It proposes to install some APT packages and they contain version numbers in their names, that's the confusing part, you have to install them like that.
sudo apt install linux-cloud-tools-5.15.0-139-generic linux-tools-5.15.0-139-generic
If you have another kernel version that 5.15, replace this number accordinglyplace this number accordingly.
Perf trick
Must sometimes use sudo !!
> perf stat -e power/energy-pkg/ ./build/floatsparty_simd

Taking default value for size of float buffer
Starting benchmark with size = 10000000
Result is correct
Benchmark done

 Performance counter stats for 'system wide':

   <not supported> Joules power/energy-pkg/u

       0.018142818 seconds time elapsed

> sudo perf stat -e power/energy-pkg/ ./build/floatsparty_simd

Taking default value for size of float buffer
Starting benchmark with size = 10000000
Result is correct
Benchmark done

 Performance counter stats for 'system wide':

              0.31 Joules power/energy-pkg/

       0.014374745 seconds time elapsed
todo test s-tui plus en détail !!
Annotate source code with time as percentage
Very strangly the flag --source is the default but not sufficient to see the source code merged with assembly. I had to had --objdump objdump to perf annotate to see them.
If you want to avoid all the code from libc called dynamically, add --dsos=<yourbinaryfile> (I guess the acronym comes from: only on these d symbols), but use an absolute path like --dsos=$PWD/build/k-mer. If you don't (like --dsos=build/k-mer) you'll get Error: The perf.data data has no samples!. If you give just the binary name --dsos=k-mer it seems to work (WTF!).
TODO: how to have only cpu_core and not cpu_atom ?? what's really the difference actually ?
sudo perf record --call-graph dwarf -e cpu-cycles ./build/k-mer data/10m.en.txt 4
sudo perf annotate --objdump objdump  | bat -l c
Here is the extract of the result opened in a pager.
6974   │  Percent |  Source code & Disassembly of k-mer for cpu_core/cpu-cycles/ (8215 samples, percent: local period)
6975   │ -----------------------------------------------------------------------------------------------------------------
6976   │          :
6977   │          :
6978   │          :
6979   │          : 3      Disassembly of section .text:
6980   │          :
6981   │          : 5      0000000000401490 <add_kmer>:
6982   │          : 6      table->count = 0;
6983   │          : 7      table->capacity = 0;
6984   │          : 8      table->entries = NULL;
6985   │          : 9      }
6986   │          :
6987   │          : 11     void add_kmer(KmerTable *table, const char *kmer, const int k) {
6988   │     0.31 :   401490: push   %r15
6989   │     0.14 :   401492: push   %r14
6990   │     0.00 :   401494: push   %r13
6991   │     0.02 :   401496: push   %r12
6992   │     0.00 :   401498: push   %rbp
6993   │     0.05 :   401499: mov    %rdi,%rbp
6994   │     0.00 :   40149c: push   %rbx
6995   │     0.05 :   40149d: mov    %rsi,%rbx
6996   │     0.20 :   4014a0: movslq %edx,%rsi
6997   │     0.11 :   4014a3: sub    $0x8,%rsp
6998   │          : 22     KmerEntry *entries = table->entries;
6999   │          : 23     size_t tableCount = table->count;
7000   │     0.00 :   4014a7: mov    0x8(%rdi),%r9d
7001   │          : 25     KmerEntry *entries = table->entries;
todo useful to perf annotate ??
sudo dnf debuginfo-install glibc
sudo dnf debuginfo-install libstdc++