Debug
Important notice
If you didn't run asm doctor at the start of the lab, like explained in the previous page, you'll get this error failed to find romfile "vgabios-stdvga.bin" for debug as well and will not be able to start.
Available options
The course is teaching you how to debug with Eclipse only... The only nice thing about Eclipse is its advanced debug features. VSCode on the contrary is more limited but could be enough for most cases.
We don't know the exact difference between Eclipse and VSCode, it seems impossible to manually change the value of a CPU register in VSCode. Variable can be changed though. If some limitations are too annoying, come back to Eclipse.
You can also try to use gdb commands directly, but this is a bit hardcore mode...
By default, starting a debug session is a pain and require at least 4 manuals steps!
In the following sections, we'll describe the 3 options, starting with the one we recommend the most. For most students, we recommend using VSCode but trying Eclipse at least once to serve as a backup solution for VSCode limitations.
VSCode in just one shortcut
Note: this only concerns debugging .bin files in Qemu... This doesn't support C debugging when running binaries natively (such as exo1.c in first lab).
-
At the start of the lab, run
asm vscodeto detect the.binfiles and generate debug configurations
-
Build your code if you made changes:
asm make -
Put a breakpoint somewhere in your code.
-
Go in the Debug panel of VSCode and choose the appropriate debug configuration
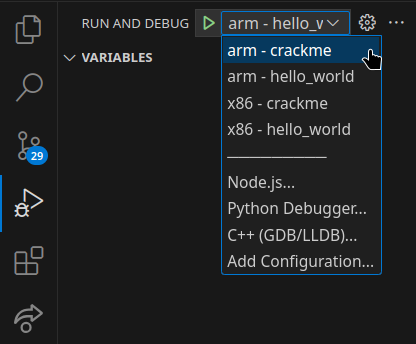
-
Run this configuration (or just press
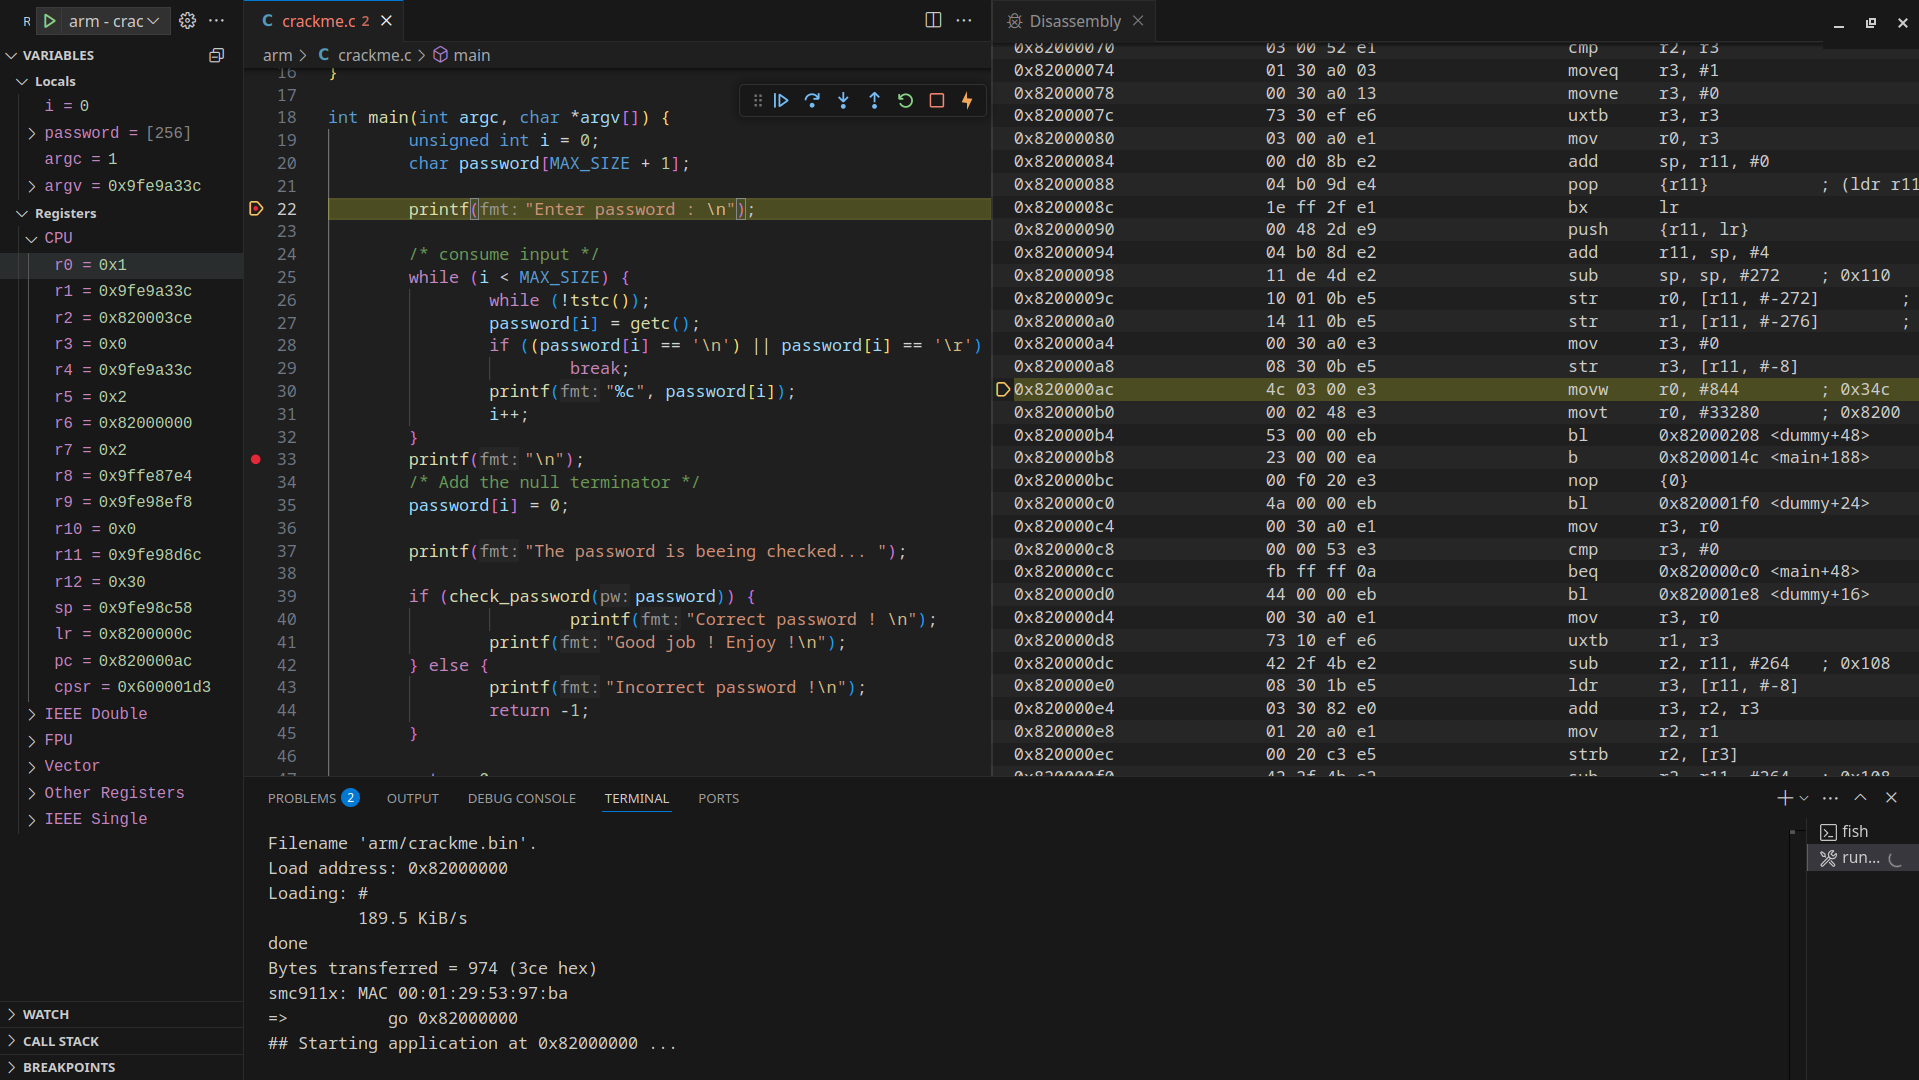
F5), wait 7s, when the activity bar at the bottom turns colored, thego 0x...should happen just after that the code should stop at your breakpoint. -
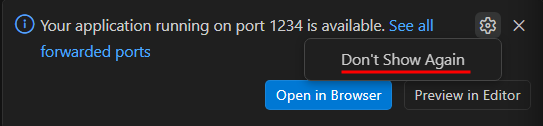
If you see this message, you can check the box and click
Debug anyway, it will not show again. This is a known issue we couldn't fix.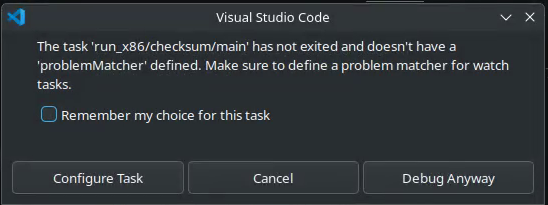
-
The program output is shown in VSCode's
Terminaltab -
If needed, you can inspect the assembly (and move instruction by instruction) via the Command palette >
Open Disassembly View -
You can change the value of a variable
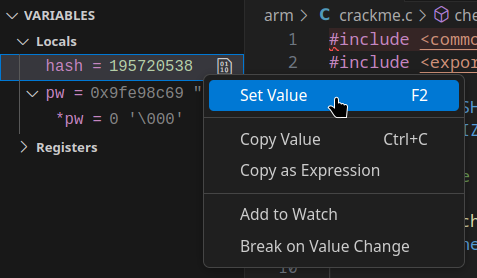
-
When you see the Uboot shell
=>after the program exit, you can hitEnterto restart the debug directly if desired. -
If you want to stop or interrupt the debug, hit
Shift+F5. It should completely kill the debug session and close the terminal. If for some reason the terminal session is stuck, tryEnter,ctrl+cor the trash icon. Then you can restart the process at step 2.
You can hide these annoying popup
Eclipse with the CLI in parrallel

-
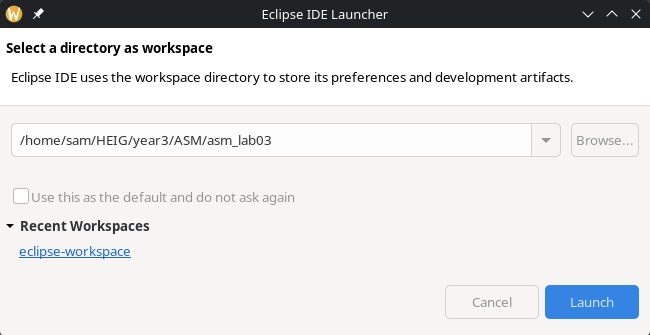
Make sure the current workspace is the lab directory.
-
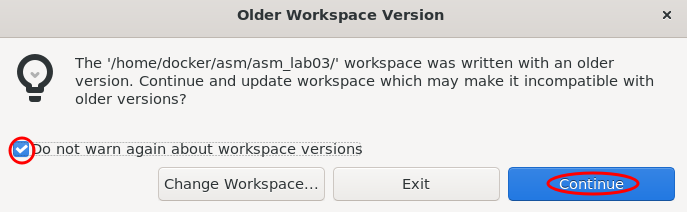
If you see this error, you can ignore it.
-
Build your code:
asm make -
Start the binary in Qemu for debugging:
asm debug arm/hello_world.bin -
It will wait 7 seconds to let you start the debug in Eclipse.
If this pause is too short for you, it can be configured (see
asmhelp).
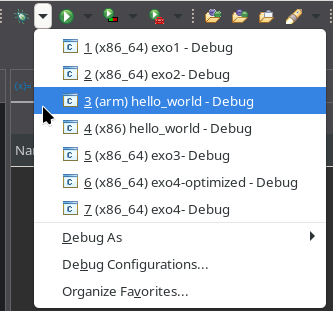
Note: If you don't see these debug entries, this is because you don't have the CDT plugin, as described in the setup page. -
Fix the issue with debuggers not starting
See the fix
The
arm-none-linux-gnueabihf-gdbbinary will not be found or will crash...i686-linux-gdbmight also not be found.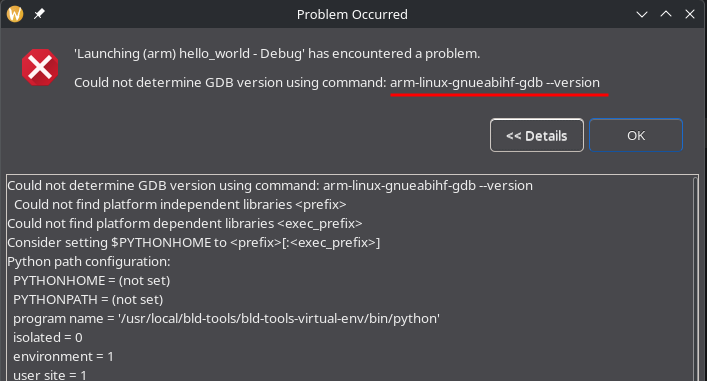
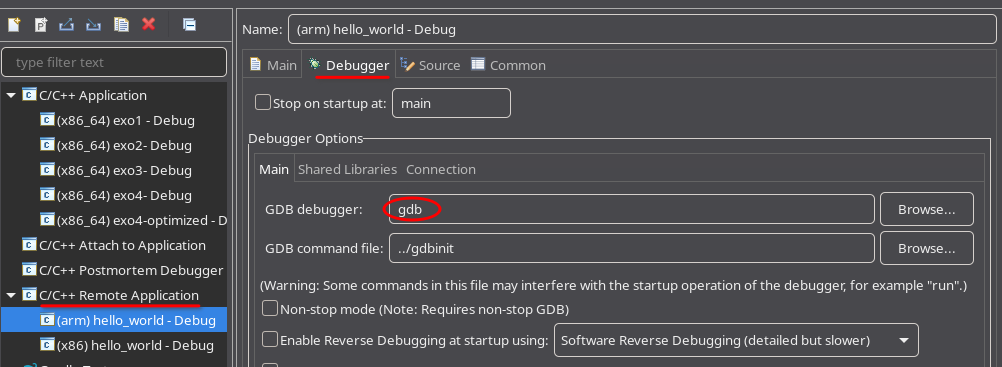
The solution is easy: you have to manually replace the gdb binary in the Debug configurations. At left, for all entries for ARM and x86 you change this. On Fedora
gdbis a perfectly fine replacement. On Ubuntugdb-multiarchworks fine.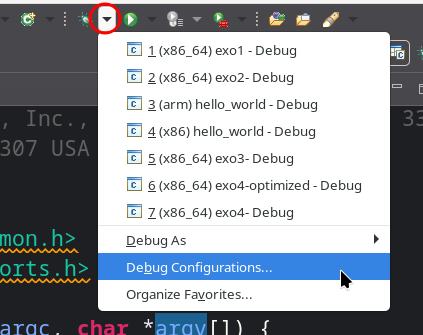
-
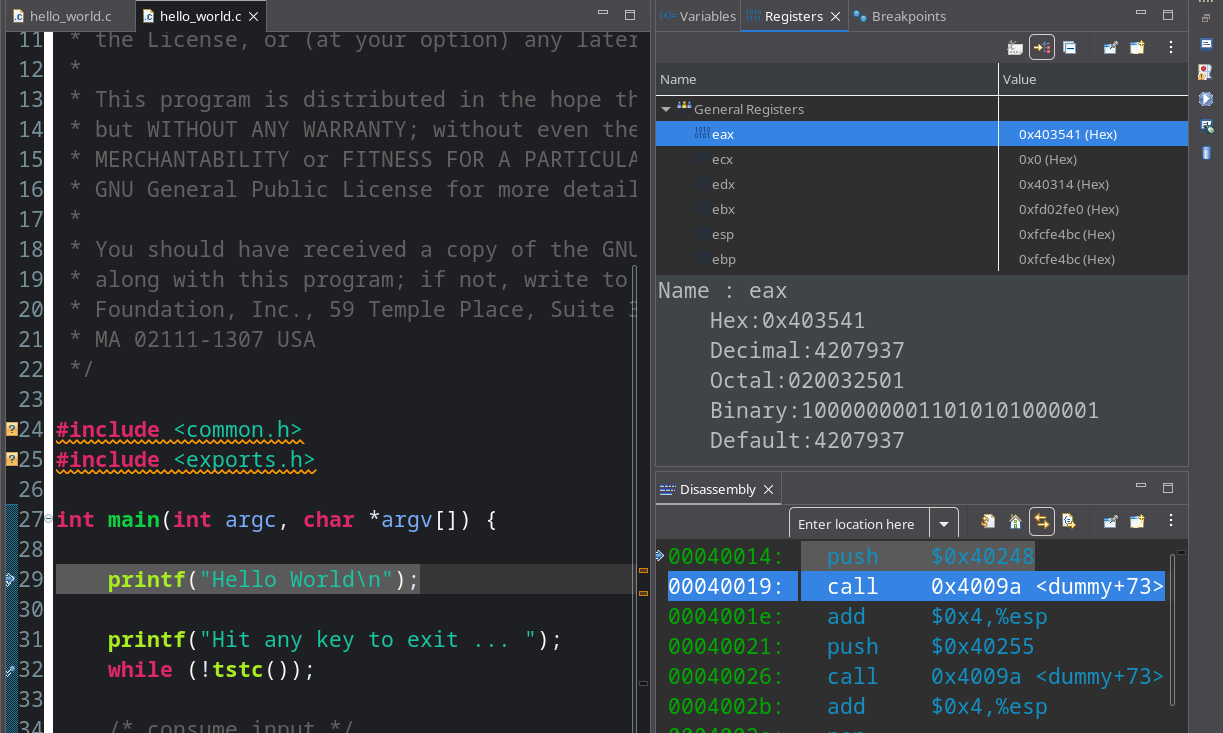
Then it will run the
go 0x...command. Eclipse will show you the program stopped on the first breakpoint. -
Eclipse is showing disassembly, variables and registers panels. The registers can be edited directly in the associated panel.
GDB only for the raw experience
If you go down this route, you might find useful to use a GDB frontend to have a better UI.
Here is an example to debug x86/crackme.bin in ./st86, in 2 terminal windows: window 1 is for GDB and window 2 is for qemu
- Window 2:
- Run
./st86(for arm it would be./st) - Run
setenv cmd "tftp x86/crackme.bin" - Run
run cmd
- Run
- Window 1:
- run
gdborgdb-multiarch(Fedora or Ubuntu respectively) - run inside gdb
file x86/crackme - run inside gdb
target remote localhost:1234
- run
- Window 2:
- Run
go 0x40000
- Run
- The debug should now be ready
- Window 1:
- You should be able to run standard gdb commands like
listto see source codeb 20to set a breakpoint at line 20cto callcontinueused to go until next breakpointnto go tonextinstructionnito go tonextiassembly instruction
- You should be able to run standard gdb commands like